Business Strategy, Consumer Trends 26 August 2026
Q2 2026 Top 12 CPG Companies – Volume Is Back, Focus Is The Differentiator
Volume remains positive: average growth was about +1.0%, with 9 of 12 companies growing volume.
Pricing is still the larger contributor: the value/volume growth ratio moved from 1.5x in Q1 to 1.9x in Q2.
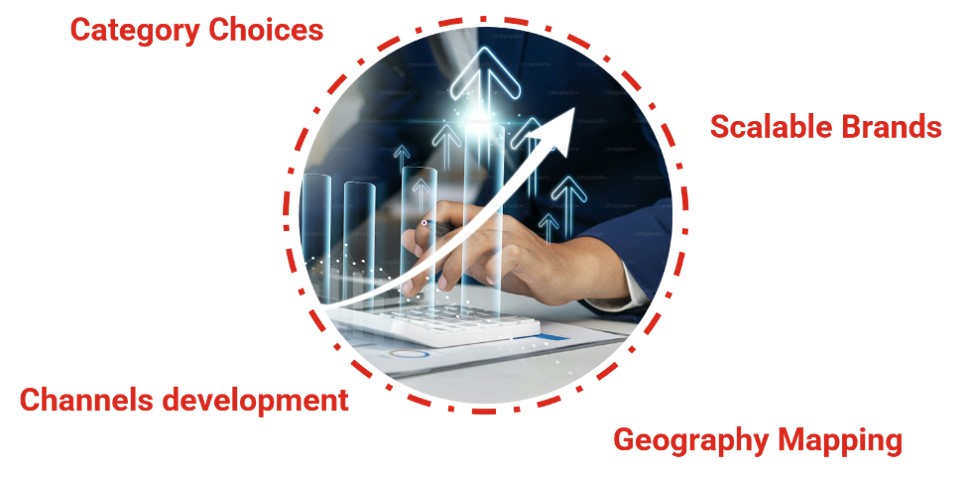
The strongest momentum is linked to deliberate focus across categories, scalable brands, geographies and channels.
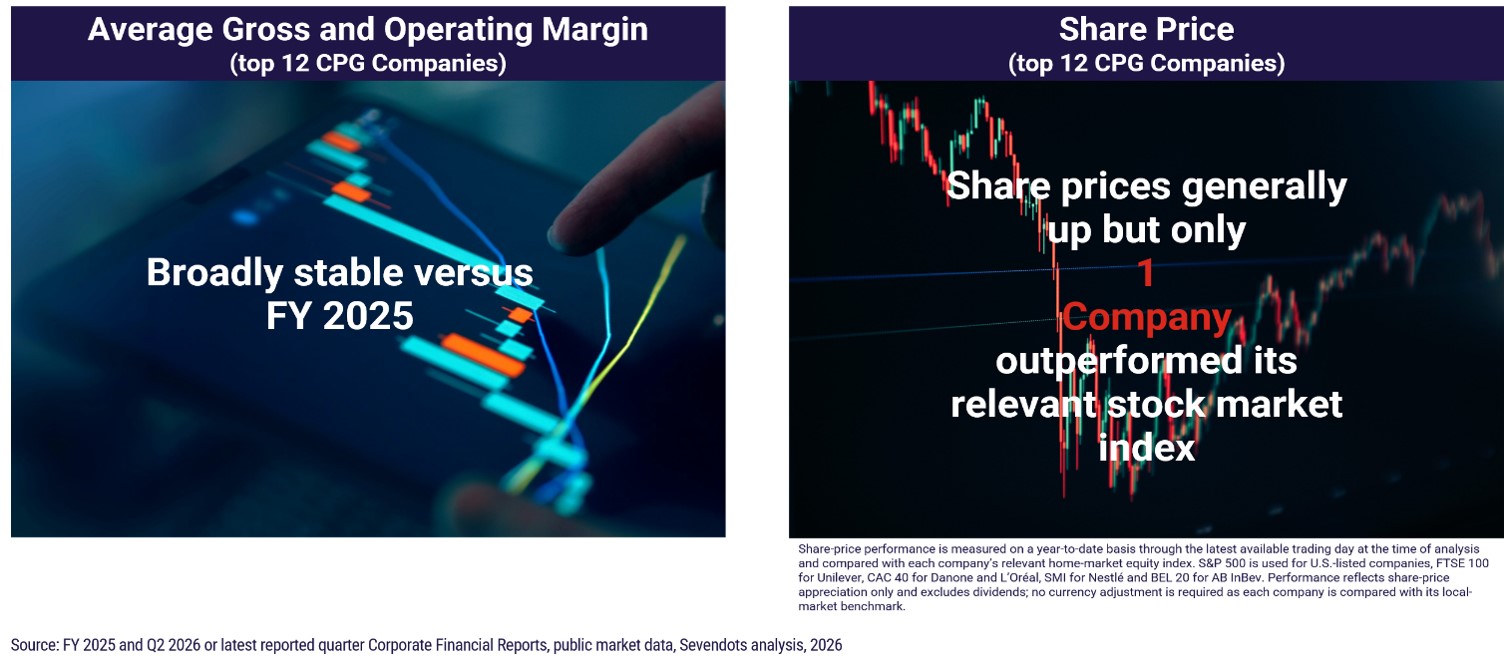
The financial markets are still waiting for proof: margins are broadly stable and only one company outperformed its relevant home-market index over the period analyzed.
Sevendots, Rome
10 minute read
Good overall volume growth
Our Q2 2026 review of 12 of the world’s leading consumer packaged goods (CPG) companies shows a clear change in the growth equation. Average volume growth reached +1.0%, with nine of the 12 companies growing volume. After the prolonged weakness of the previous cycle (see FY 2025 analysis in the article “2025: A Structural Divide in Global CPG performance”) this is an important shift: volume is again at the center of the growth agenda.
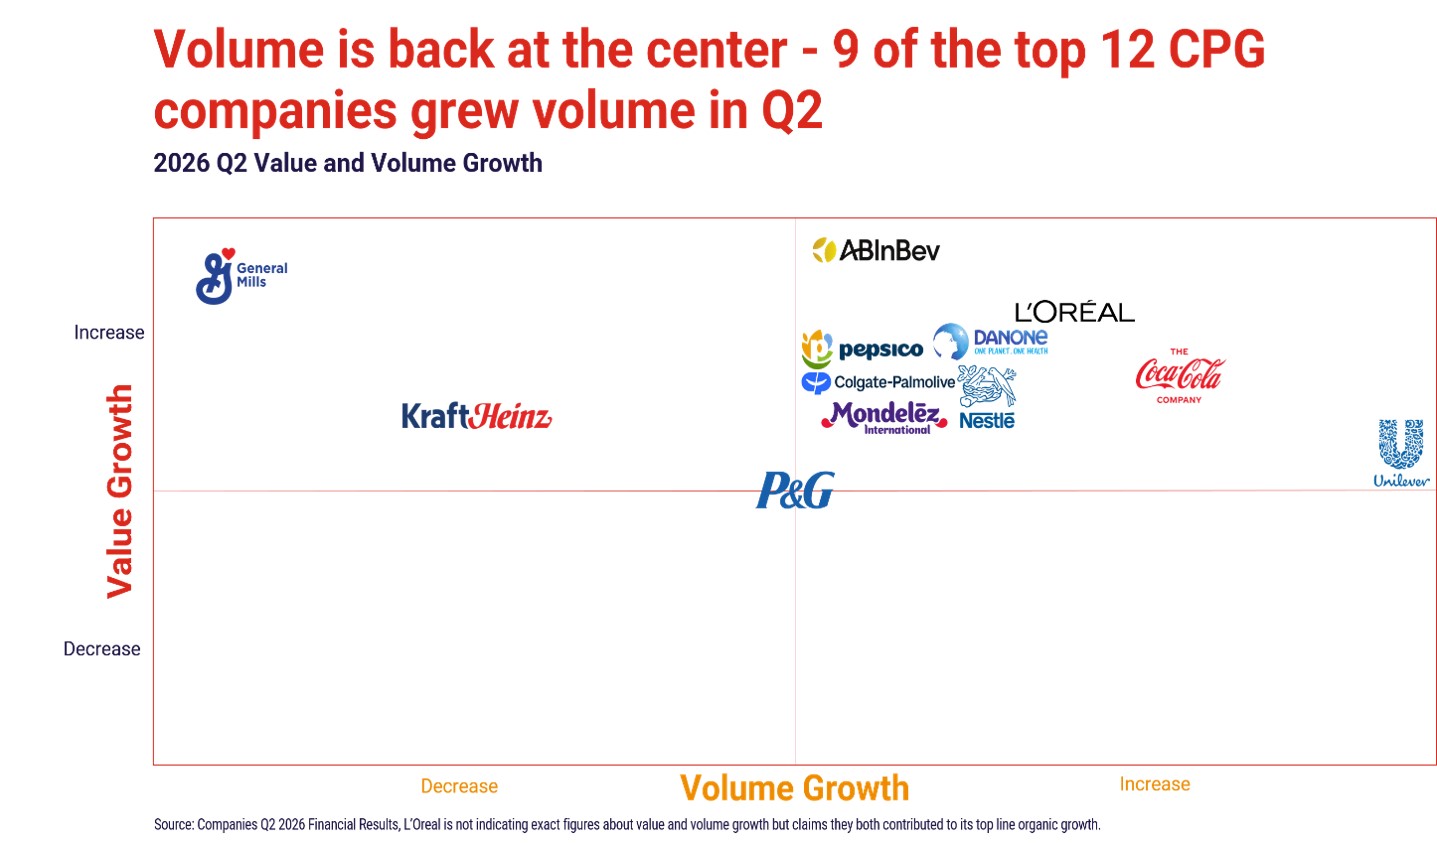
The recovery, however, is not accelerating. Q2 was softer than Q1, and the balance of growth moved slightly back toward value. The ratio between value and volume growth increased from 1.5x in Q1 to 1.9x in Q2. Pricing and mix therefore remain the larger source of organic growth, even as more companies succeed in protecting or rebuilding volume.
This matters because the strategic challenge has changed. In 2025, the question was whether large CPG companies could stop the volume decline. In 2026, the more relevant question is whether they can build a repeatable model in which volume, value and margin reinforce one another.
Price still does most of the work
None of the monitored companies reported negative value development in the quarter, confirming that the return of volume has not required a broad abandonment of pricing. The best performers are instead showing that the two levers can coexist when portfolio and execution are strong enough. Pricing also reflects a continued input-cost inflation.
Only 2 companies are showing stronger volume vs. value growth with Unilever standing out for the strongest performance at 5.5% (which represents about 95% of the achieved organic revenue growth). As we will see later in the article, Unilever is properly leveraging most of the main volume drivers realizing a great overall performance for the quarter. Coca-Cola follows with 6% organic revenue growth, driven by a 4% increase in concentrate sales and 2% price/mix. Unit case volume grew 5%. The distinction is important: while concentrate sales provide the closest bridge to organic revenue, reported consumer volume momentum was even stronger. Portfolio decisions and innovation appear to have played an important role in this performance.
The broader implication is important. After several years in which price increases carried much of the industry, the emerging winners are not simply reversing price. They are rebuilding purchasing acts and penetration while keeping enough pricing and mix to sustain value.
The capital markets are still waiting for proof
The improvement in volume has not yet materially changed financial conversion. Average gross and operating margins remain broadly stable, with only limited basis-point movements. Share prices improved on average, but only one of the 12 companies outperformed its relevant stock-market index over the period analyzed.
That gap suggests the recovery is still being treated as early-stage. Investors are likely to require evidence that volume can translate into stronger, repeatable cash generation and profitable share gains, not simply a better quarterly shipment number. For CPG leaders, the next step is therefore to turn volume recovery into a sustained economic algorithm.
Focus is becoming the growth algorithm
Across the Q2 disclosures, one theme appears repeatedly: focus. Companies are making more explicit choices about the categories in which they want to compete, the brands that deserve disproportionate support, the geographies where penetration can be expanded and the channels that can create incremental purchasing occasions.
This is a meaningful evolution from the inflationary period, when top-line growth could be supported more mechanically through pricing. In a more price-sensitive environment, growth depends much more on where a company decides to place its resources and on whether those choices fit its capabilities, culture and route to market.
Category choices: where to play is back at the center
Most of the companies are reassessing category exposure as a source of long-term value creation. Q2 performance makes the consequences visible: results are increasingly shaped not only by execution within a category, but by the structural attractiveness of the spaces in which companies choose to compete.
Kraft Heinz, which reported an overall volume decline of 2.6%, linked much of the pressure to meats and spoonables. The result underlines how mature or challenged demand spaces can become a significant drag when propositions do not keep pace with changing consumer expectations.
P&G illustrates the other side of the coin. Hair Care delivered good volume growth, while the much larger Baby, Feminine & Family Care, Health Care and Oral Care areas declined by around 2%. Fabric & Home Care was broadly flat, with Fabric Care growth offset by softer Home Care. A diversified portfolio does not automatically create resilience; category mix still matters.
Danone continues to benefit from its sharper exposure to health-oriented demand spaces. Essential Dairy & Plant-Based, including functional dairy and Alpro, together with Specialized Nutrition, remain important contributors to its momentum.
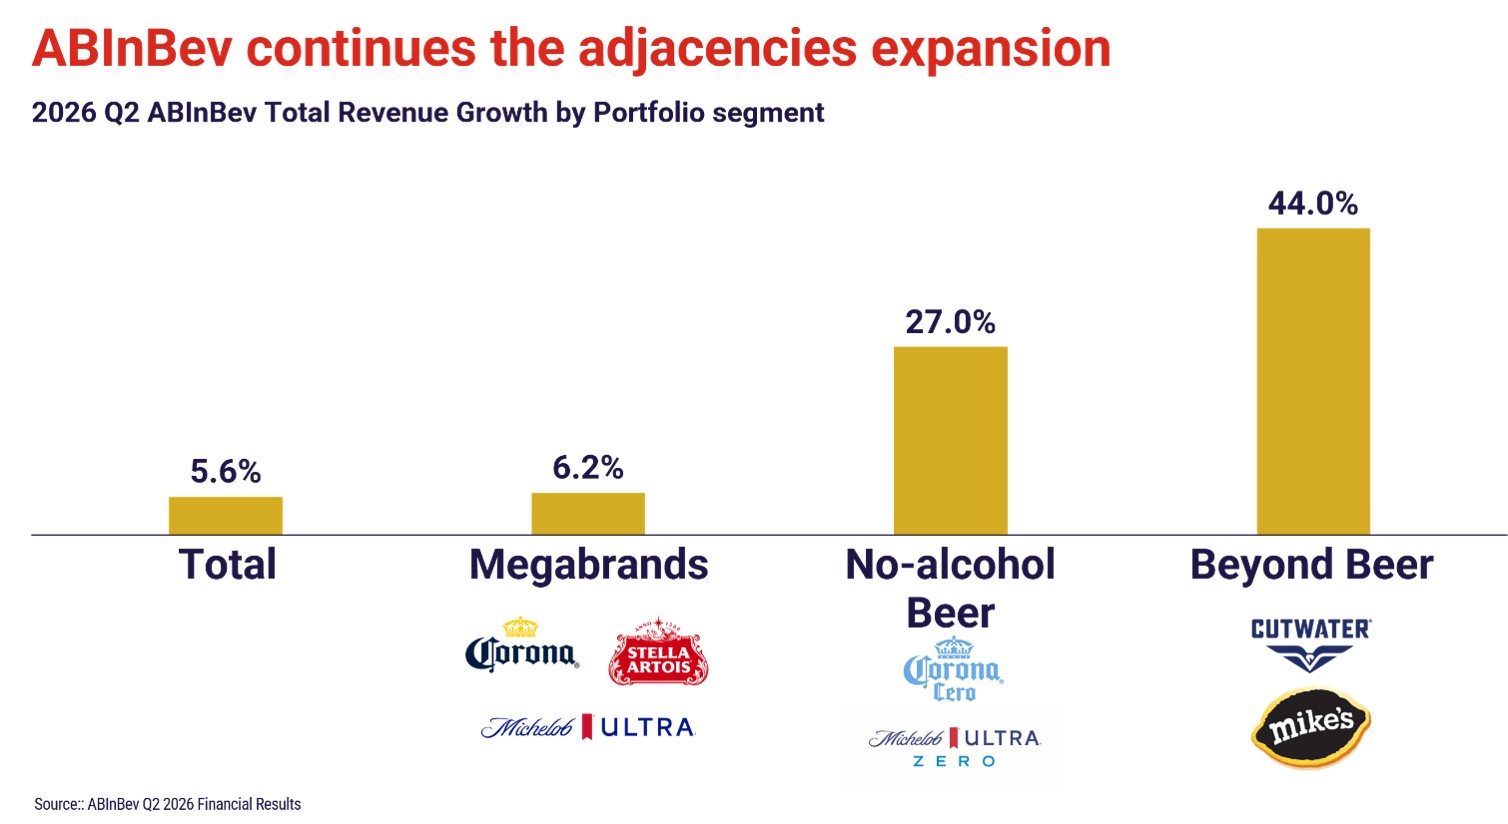
AB InBev provides perhaps the clearest example of category adjacency as a growth lever. No-alcohol beer revenue grew 27% and Beyond Beer 44%, extending the pattern already visible in Q1. For alcohol companies, these spaces are becoming more than tactical extensions: they are part of a broader redefinition of the portfolio around evolving occasions and moderation.
M&A is becoming more strategic and more selective
Linked to the previous point, the role of M&A is also evolving. The strongest logic in the recent deals is less about adding external revenue or acquiring capabilities to be leveraged internally and more about accelerating a portfolio direction that is already clear: i.e. health, functionality, premiumization, local relevance or access to a new consumer base.
Danone explicitly frames the agreements to acquire Huel and Made Group as a way to strengthen attractive health-focused categories and scale them across priority geographies. This is consistent with a portfolio model in which acquisitions reinforce platforms the company already knows how to build.
P&G’s announced intention to acquire Thorne follows a similar logic. The strategic value is not simply entry into vitamins and supplements; it is access to a science-backed, practitioner-trusted and premium consumer-health proposition where credibility can sustain differentiation.
L’Oréal’s signed agreement to acquire Innovist in India adds another dimension: local market penetration. A local personal-care champion can complement L’Oréal’s global brand assets with propositions built around local consumer needs, accelerating coverage in a market where the company still has room to expand in terms of portfolio distribution and penetration.

Several large players appear willing to pay premium multiples for businesses with an ecosystem they can scale: strong brands with loyal consumers, differentiated products backed by R&D and credible claims, a proven combination of DTC and retail, and economics that can support growth without sacrificing profitability.
From portfolio breadth to scalable brands
The same concentration is visible at brand level. Unilever, AB InBev, Nestlé and Danone are all talking more explicitly about selected brands, platforms and growth engines rather than broad portfolio averages.
Unilever’s Power Brands, representing 78% of turnover, grew 6.0% organically with 5.4% volume growth. The company continues to direct disproportionate investment behind them. The message is straightforward: scale the assets with the greatest ability to recruit, travel across markets and absorb innovation.
AB InBev reported strong momentum for Corona, Stella Artois and Michelob Ultra outside their home markets, with revenue growth of 17%, 19% and 21% respectively. This proves the focus and the ability to scale global brands. Its sales and marketing investment reached $4.1 billion in the first half of 2026, up 9% year on year, reinforcing the idea that brand concentration and investment intensity are moving together.
Nestlé reported around 7% organic growth across its defined growth platforms and increased advertising and marketing expenses to 8.9% of sales.
Kraft Heinz is also increasing brand investment by $100 million, to approximately $700 million in 2026, arguing that its brands respond when support is stepped up.
Colgate increased advertising investment by 15% in Q2 claiming it will continue to keep spending high for the rest of the year.
This shift matters because large portfolios can create the illusion of optionality while diluting resources. In a fragmented market, the companies with the greatest scale advantage may increasingly be those willing to concentrate that scale behind fewer assets, also because leading brands within categories generally warrant higher margins than followers.
Big experiences: turning reach into cultural and commercial scale
Q2 also shows the renewed importance of large cultural platforms, especially around the FIFA World Cup. The strategic value is not the sponsorship itself, but the ability to convert a global property into an integrated activation system across media, creators, retail, customers and local market execution.
Coca-Cola’s FIFA World Cup Trophy Tour made more than 70 stops across roughly 30 markets and reached around 700,000 fans. The broader program touched more than 20 million retail outlets and generated very large digital and social reach through more than 2,500 content creators.

AB InBev similarly used major platforms since the beginning of the year, including the Winter Olympics, Roland Garros, Wimbledon and the FIFA World Cup, to build cultural relevance for its brands, reporting 850 million consumer engagements on social media across these occasions.
These programs matter when they create more than visibility. Their real value comes from connecting global brand power with local purchasing occasions and retail execution. In that sense, “mega platforms” can become another form of scale advantage: a repeatable way to make a brand culturally relevant across multiple markets at once.
Also, as discussed in our article “The Experience Economy: Why Growth Is Increasingly Driven By Experience” the role of transformative experiences where the brand has a natural fit can build a strong and lasting differentiation.
Geography: Growth is increasingly a map problem
The recovery is not evenly distributed, and geographic mix is becoming a more visible determinant of performance. Companies with a broader footprint and the ability to shift investment toward faster-growing markets have more opportunities to protect overall penetration when developed markets soften.
L’Oréal’s North Asia performance stood at roughly 2.2 times the company average, while North America was closer to the group trend and Latin America and Europe grew more slowly. The result reinforces the value of geographic balance: the same portfolio can produce very different outcomes depending on where it is deployed.
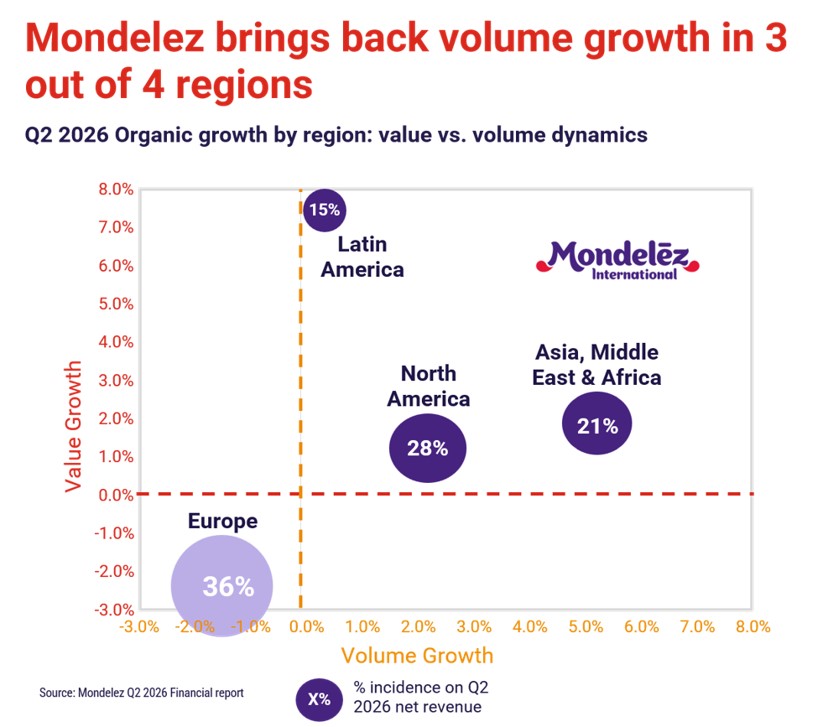
Mondelez shows the contrast even more clearly. Emerging geographies grew 4.4% versus only 0.7% in developed markets, with volume growth of 1.6% versus 0%. At regional level, Asia, Middle East & Africa delivered 7.1% organic growth, including 5.2% volume, while Europe declined 3.5%, with both volume and value negative. Latin America and North America returned to positive volume growth.
Nestlé also reported positive organic growth across all three geographic zones. Emerging markets excluding China strengthened in the first half, with 7.1% organic growth and 3.9% volume growth.
The implication is not simply “emerging markets are better.” It is that geographic prioritization has to become more dynamic. The largest companies need to identify where category growth, consumer recruitment and their own route-to-market capabilities can combine to generate the highest incremental return.
Channels: Expanding and increasing coverage remains an important lever
Channel choices are also producing a more visible payback.
L’Oréal continues to grow strongly in e-commerce, where its business is expanding at a double-digit rate and nearly twice as fast as the market.
AB InBev reported 12% growth versus Q2 2025 across its digital DTC platforms—Zé Delivery, TaDa Delivery and PerfectDraft. Third-party products sold through its DTC marketplace generated $50 million in GMV, up 63% year on year.
The more strategically interesting asset may be BEES Marketplace, a BtoB platform available in 30 markets and serving more than 6 Million customers. It generated approximately $1.2 billion of third-party GMV in Q2, +50% year-on-year. By allowing retailers to purchase third-party products alongside AB InBev brands, the platform does more than digitize ordering. It deepens retailer relationships, creates a richer data layer and gives the company greater visibility into assortment, demand and purchasing patterns.

This is a useful reminder that channel strategy is no longer only about distribution coverage. The strongest platforms increasingly combine reach, data and customer intimacy, making the channel itself a source of competitive advantage.
Innovation: Fewer headlines, but a clearer model for crafting demand
One notable feature of the Q2 statements is that innovation appears less prominently than portfolio focus, brand investment or geographic expansion. That relative downplay is itself interesting. It suggests that many companies are currently putting more emphasis on scaling proven assets than on celebrating the size of their innovation pipelines.
Coca-Cola is the clearest exception. The company describes a model built around consumer-led innovation hubs in each operating unit, designed to translate insights into locally relevant products and capture additional drinking occasions.
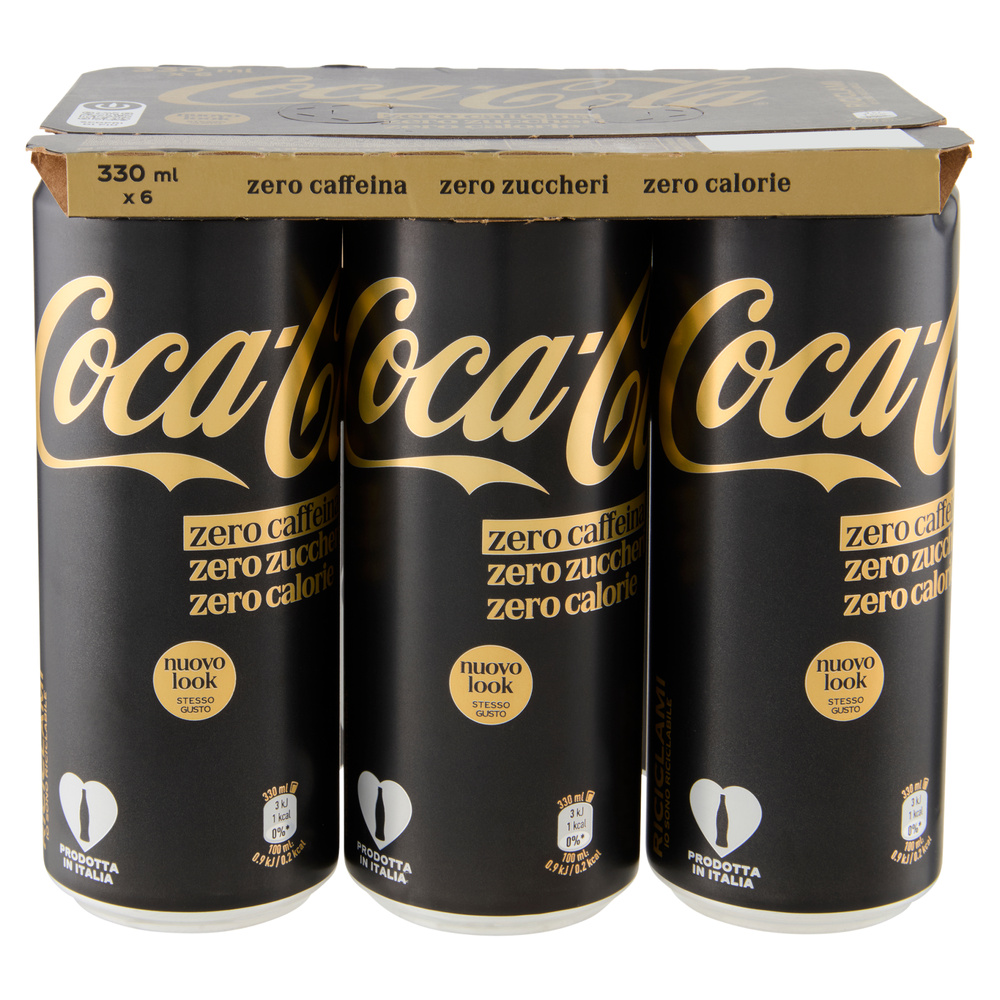
The examples show the model in practice: the expansion of Coca-Cola Zero Zero after positive European results; the adaptation of Sprite+Tea for Chinese taste preferences; and BODYARMOR FIT, which extends the portfolio further into functional hydration.


The more important point is the system behind the launches. Innovation is being localized, adapted and then scaled across markets, rather than treated as a one-off novelty. Coca-Cola linked innovation to its strong volume performance in the quarter, arguing that faster speed to market and the ability to make innovation work across more brands and geographies are creating new sources of growth.
A broad and sustained innovation pipeline across divisions is explicitly identified as one of L’Oréal’s two main growth engines, supporting market outperformance and growth across both volume and value.
AB InBev provides evidence of innovation contributing directly to volume/category growth especially around no-alcohol beer and new occasions. Colgate explicitly positions science-led innovation as a strategic growth driver.
The Path Forward: from volume recovery to volume discipline
Q2 2026 marks another step away from the price-led growth model that dominated the inflationary years. Volume is back across most of the top 12, but the quarter also shows why the recovery should not be over-celebrated: average volume growth slowed, value remains the larger contributor, margins have not yet materially improved and capital markets are not yet rewarding the sector with broad outperformance.
What is becoming clearer is the strategic divide. The companies building the strongest momentum are making more deliberate choices and concentrating resources behind them:
- Choose categories where long-term demand is attractive, and the company has a credible right to win.
- Back scalable brands and platforms with disproportionate investment rather than spreading resources too thinly.
- Use M&A to accelerate a defined portfolio direction, not to compensate for an unclear one.
- Prioritize geographies and channels where penetration and purchasing occasions can still expand.
- Use innovation to create genuinely incremental demand, with local relevance and the ability to scale.
The next phase will therefore be less about whether volume is positive in a single quarter and more about the quality of that volume. Sustainable winners will be the companies that can convert greater penetration into profitable share gains, while preserving brand strength, margin and long-term investment capacity.
How Sevendots Can Support
Sevendots helps CPG companies translate these market signals into concrete growth choices.
Our work supports portfolio optimization at category, brand and SKU level; penetration and value-equation development; geographic and channel expansion; innovation platform design; and the strategic assessment of acquisition or divestment opportunities.
The objective is not simply to find more growth levers, but to identify the few that deserve disproportionate resources and to build the capabilities and execution model needed to scale them profitably.
A broader quarterly analysis covering the Top 35 global CPG companies is available through the Sevendots CPG Leaders Tracker Substack subscription service.