CPG Trends 29 June 2023
A 5-Dimensional Framework to Drive Exponential Returns for CPG companies in Asia
How can companies drive growth in Asia? Introducing our Growth from Within thinking.
Sevendots, Singapore
6 minute read
What is the situation for consumer packaged goods companies hoping to drive growth in Asia?
Asia is a highly complex region for the CPG industry, comprising of a range of individual markets – from developed to developing markets, across varied populations and demographics, different local laws and regulations, multiple languages, and cultural preferences – just to name a few factors! This highlights a clear lack of homogeneity across markets in this region, and in turn, demonstrates the substantial variability of revenue opportunity and profit margins across Asian markets.
Variability also exists across categories for those companies operating across multiple segments. As is often the case with large CPG companies and CPG brands, this comes as a result of competition, input costs (and rising input costs, as is a part of the post-pandemic world today), and supply chain factors impacting some categories differently to others. However, the options for growth, and therefore variance in opportunity is only increasing for companies.
As an example, the continued expansion of Ecommerce, including new forms of digital selling (Crossborder, Direct-To-Consumer, Social Commerce) across each CPG market further increases options for growth across categories. Each presents different revenue and growth potential, along with margin potential.
Combined, this emphasizes how regional performance can be understood as a ‘blended’ or combined performance of all opportunities versus ‘absolute.’ Performance can be understood as a reduction or increase from the current weighting to markets, channels, and product categories, rather than simply the underlying performance within each CPG market. In effect, there is a blurring of performance drivers. This blurring increases the likelihood of misallocating resources towards key performance drivers, ultimately causing sub-optimal performance or Return on Investment (ROI). For International and Global Management, this sub-optimal performance is magnified as the number of regions under supervision increases.
If addressed, regional growth can be increased, both short and long-term, through the better allocation of investment across markets, channels, and categories – arguably ‘Ultimate Value Creation’ when the total cost base is maintained or held constant. All of this is captured in Sevendots’ 5-Dimensions Framework, which will be explained. It is intended the primary beneficiaries of the 5-Dimensions Framework include International and Regional Business Owners, along with their Finance and Strategy Executives with ultimate responsibility for performance delivery.
Understanding ‘Growth from Within’: Opportunities for growth through clear frameworks
For CPG companies, the solution lies in establishing a framework to clearly (and simply) establish the greatest ‘Available’ and ‘Potential’ Margin opportunities across the various options in a region. Specifically, the ability to determine the revenue and margin headroom for growth in individual markets and channels by category both today (‘Available Margin’) and in the future, along with the revenue and margin opportunity across individual markets and channels in the future (‘Potential Margin’).
Once identified, this is about allocating Operating Investment (Marketing, Overheads) against ‘Where to Win’ opportunities, in large (or larger) Available and Potential Margin areas instead of lower areas, while holding the total cost base constant. This is ‘Ultimate Value Creation.’ Recognising the approach, an optimization framework enabling management to measure and track the current and future opportunities is key to maintaining and driving future performance optimization clearly and consistently.
In some regards, ‘Growth from Within’ takes on the principles of ‘Zero-Based Budgeting’. But in this instance, the approach requires the business to first identify the correct growth priorities, and then allocate costs to support. This is because, in practise, not enough investment may be available to support all Available and Potential ‘Where to Win’ areas, and therefore prioritization will ensure improvement of current investment performance to self-funding stronger growth in future.
An example of the framework in action with Self-Funded Growth
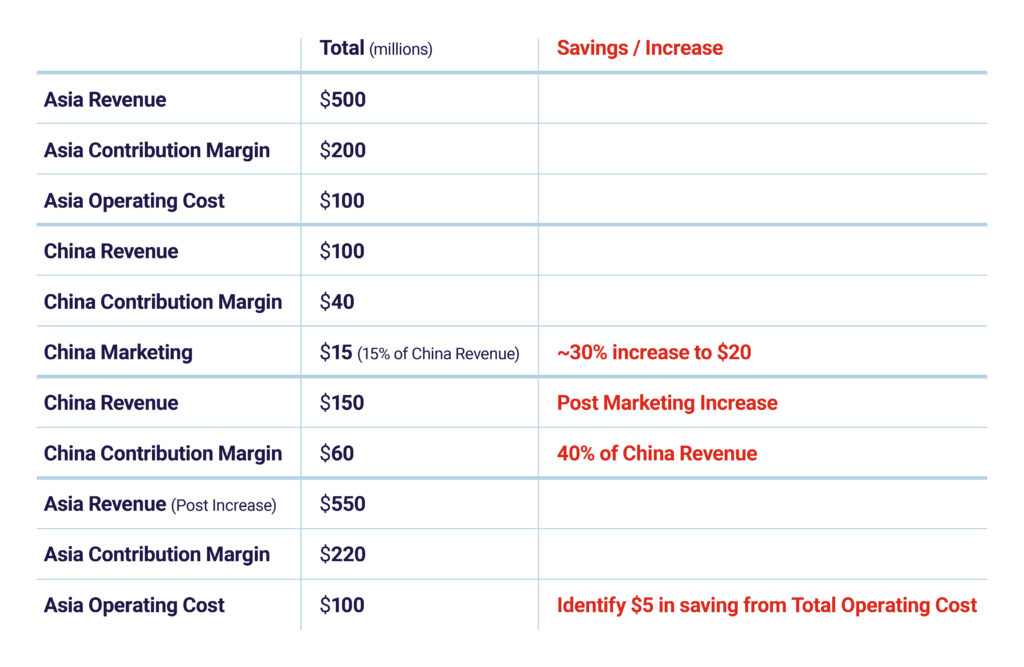
To illustrate the benefit, assume a 5% market share (Category size: $1bn) improvement is believed possible in China. If current, market share is 10%, this implies revenue of $100m, with the goal to increase market share to to 15% (an additional $50m revenue). Let’s assume the China Contribution Margin is 40%.
Let’s also assume the ‘How to Win’ is identified by increasing marketing investment, and so aiming to increase marketing investment by 30% from the current $15m to achieve this market share growth. Resulting in an incremental marketing investment of $5m, $20m. This will result in an additional $20m in Contribution Margin from China, and therefore the region ($220m ‘vs’ $200m) from the incremental $5m China marketing investment.
Now, to ensure Ultimate Value Creation, it is important to identify $5m in Operating Cost saving from across the region – namely, from other markets.
There may potentially be some revenue/margin leakage, but if we see less than $50m in revenue, there is clear value creation from improving ‘Available’ performance. A clear example of ‘Self-Funded’ Growth.
The Solution: A CPG Growth Strategy that utilizes a 5-Dimensional Framework
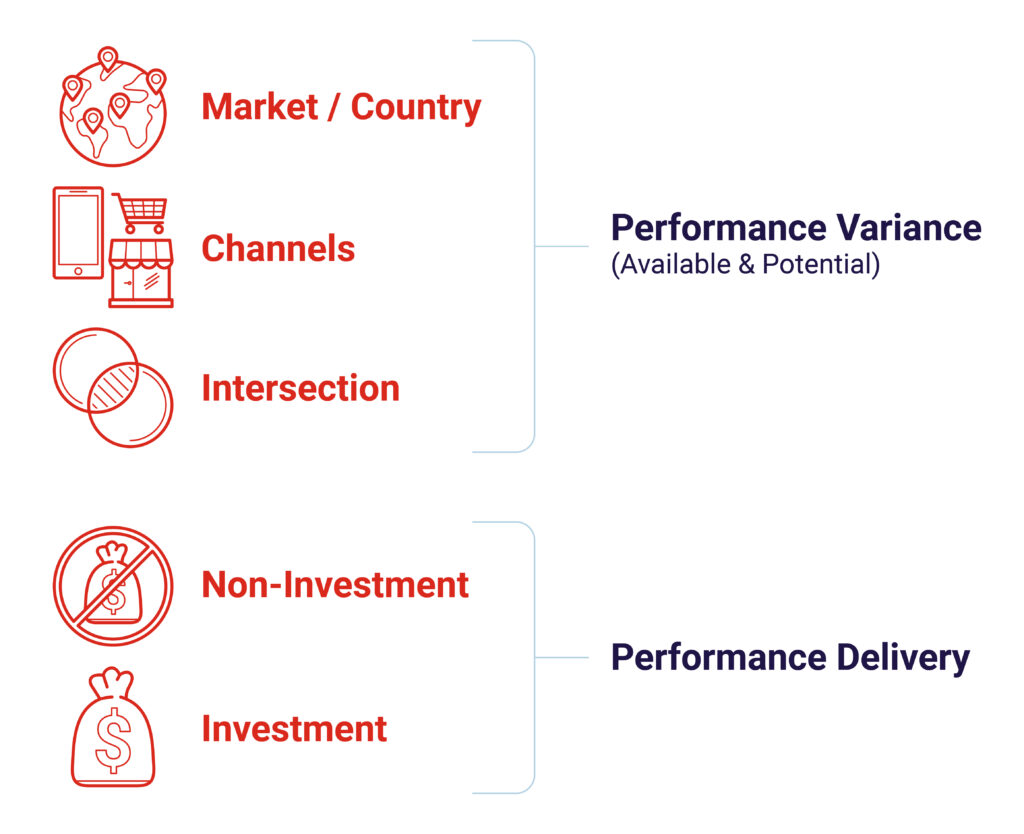
With the challenge solution in mind, a 5-Dimensions Framework has been developed to work through systematically the strongest sources of opportunity (‘Performance Variance’) and guide the re-allocation by investment to support this improved performance (‘Performance Delivery’). Again, this recognizes that total performance improvement will come from two areas: ‘Available’ and ‘Potential.’
The 5-Dimensional Self-Funded Growth Model assesses the business to understand the current key sources of opportunity and profit, with an ability to plot a way forward more easily towards higher growth and profit margin by focusing on more attractive market and channel opportunities.
The framework consists of analyses that identify value creation opportunities in two ways:
- Identifying factors based on actual and potential (future) size of prize and actual performance (‘Market Share Gap’).
- Identifying the potential profit and actual profit (‘Performance Variance’).
Once this process has been done, it is necessary to segment solutions to categorize the Performance Variance into ‘Non- Investment’ related and ‘Investment’ related to best achieve ‘Performance Delivery,’ without increasing current Operating Cost.
Understanding the 5-Dimension Framework
- Market / Country
- Channels
- Intersection
- Non-Investment
- Investment
The analysis in this section determines revenue and margin upside by analysing the size of prize today and in the future, along with margin upside amongst alternative markets, categories and channels facing a company.
In Dimension 1, analysis, each category in a Market/Country is evaluated based on its growth outlook, and current market share opportunity within the market/country, as well as individual margin performance. This is for each category.
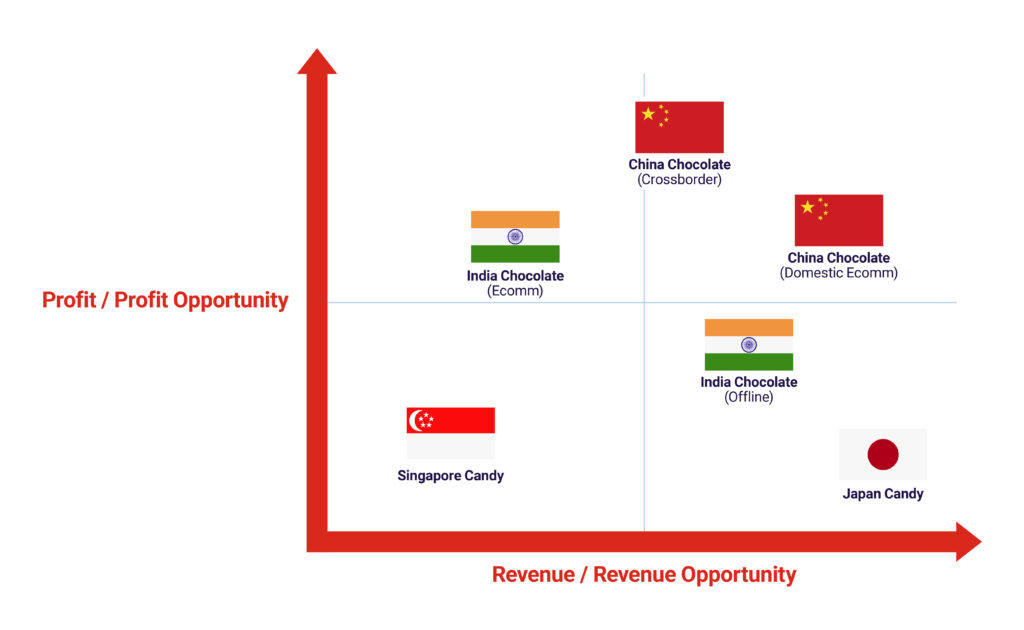
In Dimension 2, analysis of the different Channels within each market across growth outlook and current opportunity, along with profitability reflecting the different Route-To-Market and resulting ‘Cost-To-Serve’ structures. This is for each category. This is captured in Diagram 1 and reinforces the regional ‘blended profit’ versus ‘absolute profit.’
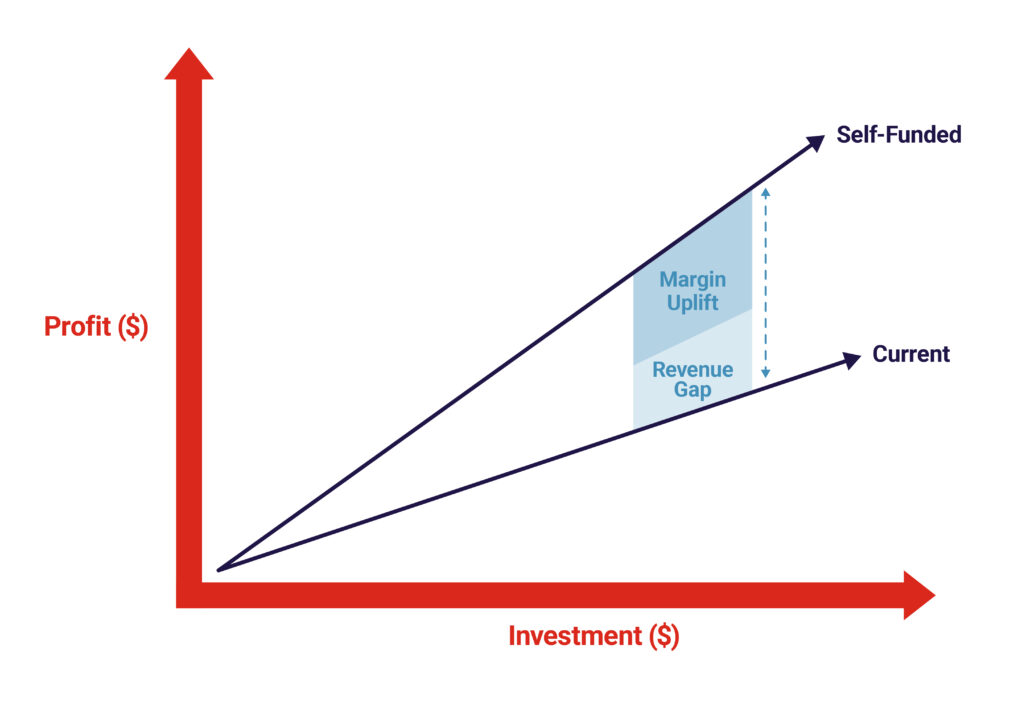
In Dimension 3, there is a consolidated assessment of Marketand Channelwithin each category to gain a clear understanding of:
- Current Revenue Gap (Available Market Share),
- Margin Uplift opportunity (Available Margin Optimisation)
- Future revenue opportunity (Potential)
From Diagram 1, the decision is then made on which individual market, channel and category opportunities the region should prioritise, namely ‘Where to Win’.
The impact (‘Performance Variance’) of the two Available inefficiencies (‘Market Share’ and ‘Margin Optimisation’) is reflected in Diagram 2, and one part of the ‘Performance Delivery’ focus. The other being ‘Potential’ or future opportunities. The analysis in this section explores how to address the Performance Variance and deliver against the Available and Potential opportunities. In Dimension 4, the Non-Investment or more ‘Tactical’ factors are considered, largely seen as more ‘immediate hanging fruit’ opportunities due to absence of investment required. Examples include Portfolio Range/Allocation, Pricing, selected Distributor KPI’s (inventory holding, margin, coverage). The process involves identifying the ‘Where to Win’ areas, analyzing what is required to succeed (i.e., ‘How to Win’), and then identifying which activities are ‘Non-Investment’.
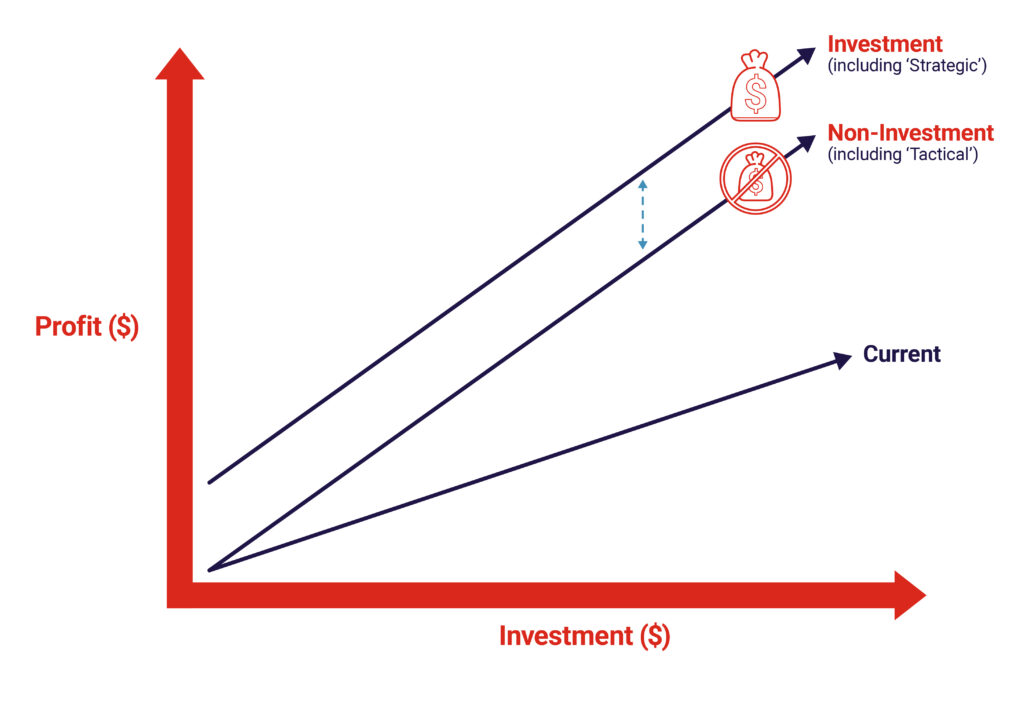
The final 5 Dimension Framework involves a similar approach, but this time identifying the ‘How to Win’ activities requiring investment, including more ‘Strategic’ changes. Examples include increasing marketing investment, local sourcing, regional warehousing vs cross-continent, amongst other initiatives. All require investment, and so must involve operating cost to be re-allocated away from other ‘Low Win’ areas to ensure Ultimate Value Creation. The approach and results can be shown in Diagram 3.
Final Takeaways for CPG companies
Identifying and prioritising growth opportunities in a world of limited resources will continue to challenge CPG companies across Asia. ‘Growth from Within’ looks to directly assist consumer goods companies both in the choice of opportunities, as well as re-allocating existing resources to ensure the most optimised growth – ‘self-funded growth,’ and with it, performance delivery. To understand how ‘Growth from Within’ can benefit and be applied to your company, please contact us.